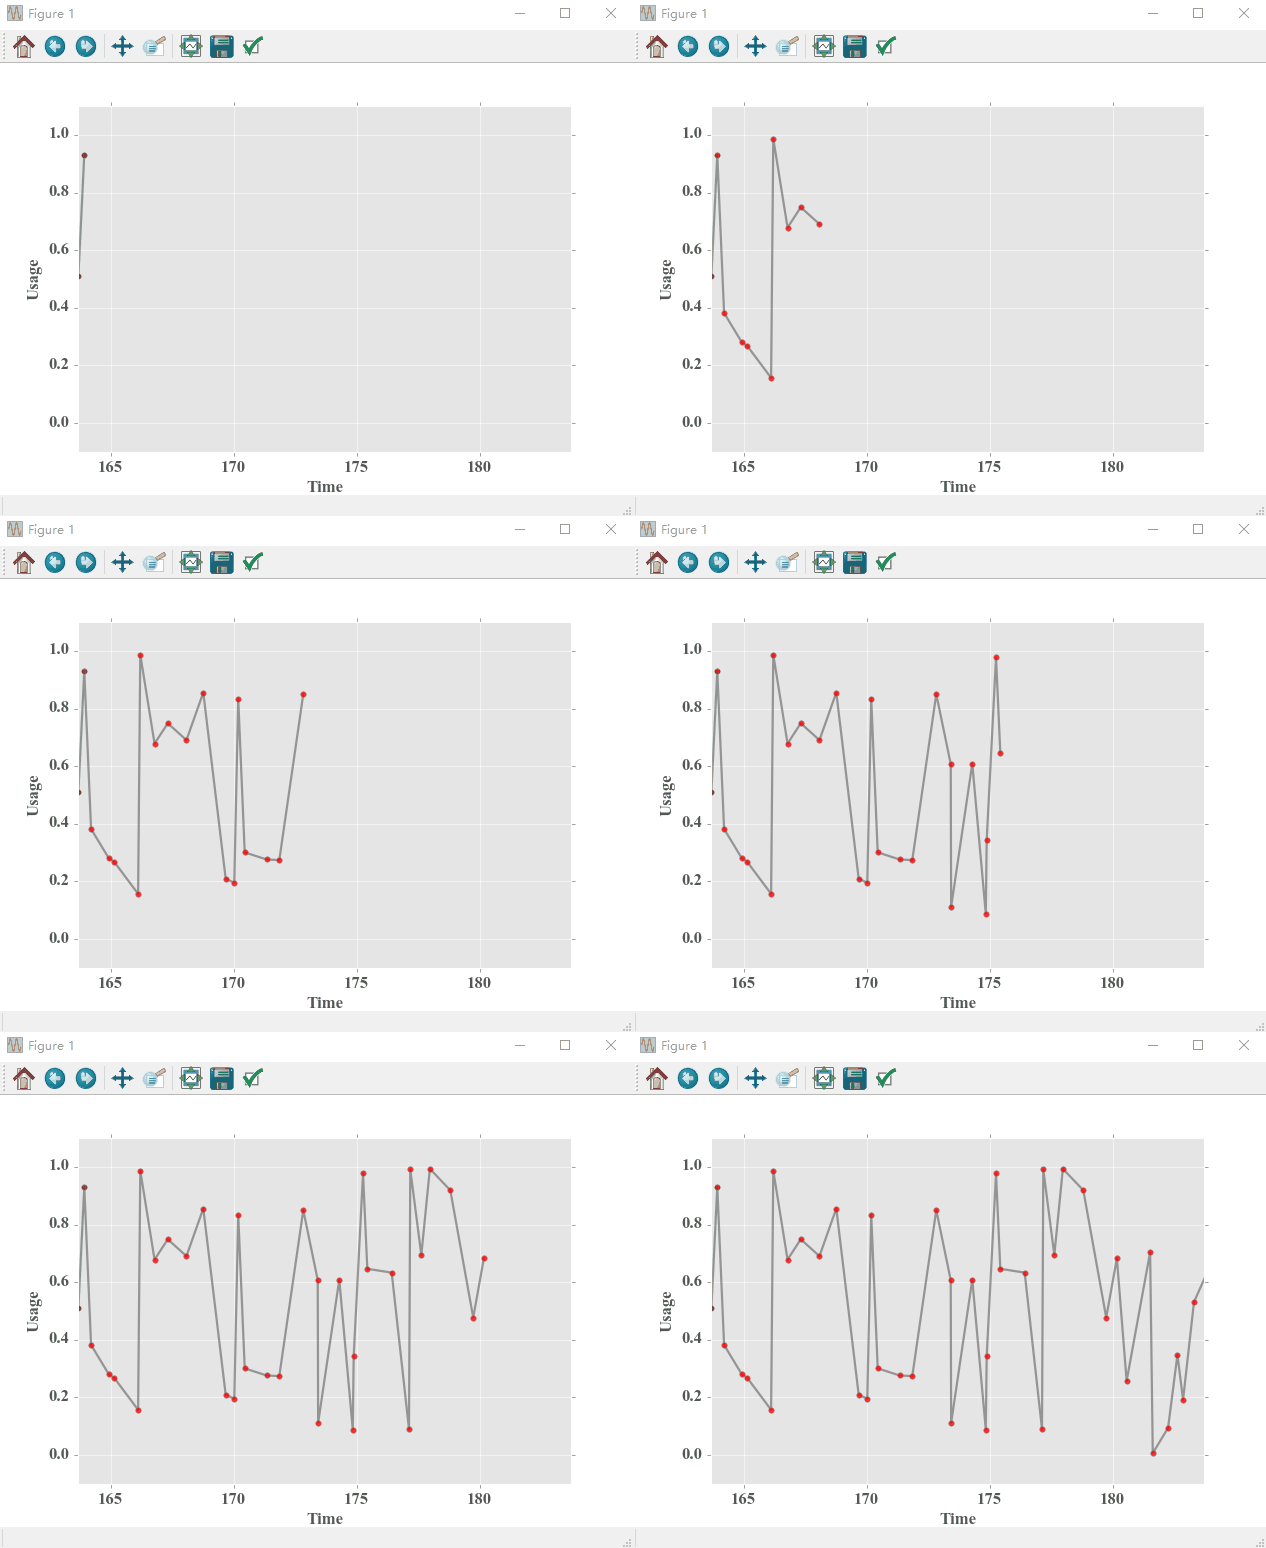
Matplotlib作为Python的绘图库,以绘制高质量的插图著称,但其实Matplotlib还是可以实现简单的动画的,虽然Matplotlib不像vispy那样调用OpenGL高性能绘图,但是用于基本的学习科研也是绰绰有余的。本文将修改一个Matplotlib默认的例子,将Matplotlib转换为一个简单的CPU监视器,并简单介绍一下Matplotlib的动画函数的用法。
在正式开工之前,需要了解一下Matplotlib的动画函数:matplotlib. animation. FuncAnimation,这个函数的使用比较复杂,但是原理很简答,首先看一下函数的参数:
class matplotlib.animation.FuncAnimation(fig, func, frames=None, init_func=None, fargs=None, save_count=None, **kwargs)
简单说明一下,在**kwargs中包含着更多的参数,这里选择一个常用的interval函数,interval用来指定每个多少毫秒进行页面刷新,在进行页面刷新的时候,FuncAnimation则会调用func函数并同时根据frames进行绘图。这个frames可以是迭代器,生成器或者是一些列的frames。
下面先期实现简单的动画功能,目标如下图所示:

Matplotlib实现CPU监视
实现代码如下:
|
1 2 3 4 5 6 7 8 9 10 11 12 13 14 15 16 17 18 19 20 21 22 23 24 25 26 27 28 29 30 31 32 33 34 35 36 37 38 39 40 41 42 43 44 45 46 47 48 49 50 51 52 53 54 55 56 57 58 59 60 61 62 63 64 65 66 67 |
# -*- coding: utf-8 -*- """ Created on Fri Nov 18 18:49:08 2016 @author: orycho """ import numpy as np from matplotlib.lines import Line2D import matplotlib.pyplot as plt import matplotlib.animation as animation import matplotlib matplotlib.style.use('ggplot') # Axis setting xRange = 20 ymin = -0.1 ymax = 1.1 class Scope(object): def __init__(self, ax, maxt=xRange): self.ax = ax self.maxt = maxt self.xdata = [0] self.ydata = [0] self.line = Line2D(self.xdata, self.ydata, ls='-',lw = 2, marker = '.', alpha=0.8, color='gray', mfc='red', ms = 10) self.ax.add_line(self.line) self.ax.set_ylim(ymin, ymax) self.ax.set_xlim(0, self.maxt) def update(self, y): # self.ax.set_xlim((max(self.xdata)-20) / 1.05, max(self.xdata) * 1.1) # self.ax.figure.canvas.draw() lastt = self.xdata[-1] if lastt > self.xdata[0] + self.maxt: self.xdata = [self.xdata[-1]] self.ydata = [self.ydata[-1]] self.ax.set_xlim(self.xdata[0], self.xdata[0] + self.maxt) self.ax.figure.canvas.draw() t = self.xdata[-1] + y[0] self.xdata.append(t) self.ydata.append(y[1]) self.line.set_data(self.xdata, self.ydata) return self.line def emitter(): while True: yield (np.random.rand(1),np.random.rand(1)) fig, ax = plt.subplots(figsize=(10, 8), dpi=80, facecolor='w', edgecolor='k') plt.xlabel('Time',fontname="Times New Roman",fontsize = 15) plt.ylabel('Usage',fontname="Times New Roman",fontsize = 15) for tick in ax.get_xticklabels(): # 设置标签字体 tick.set_fontname("Times New Roman") tick.set_fontsize(15) for tick in ax.get_yticklabels(): tick.set_fontname("Times New Roman") tick.set_fontsize(15) scope = Scope(ax) # pass a generator in "emitter" to produce data for the update func ani = animation.FuncAnimation(fig, scope.update, frames = emitter, interval=100, blit=False) plt.show() |
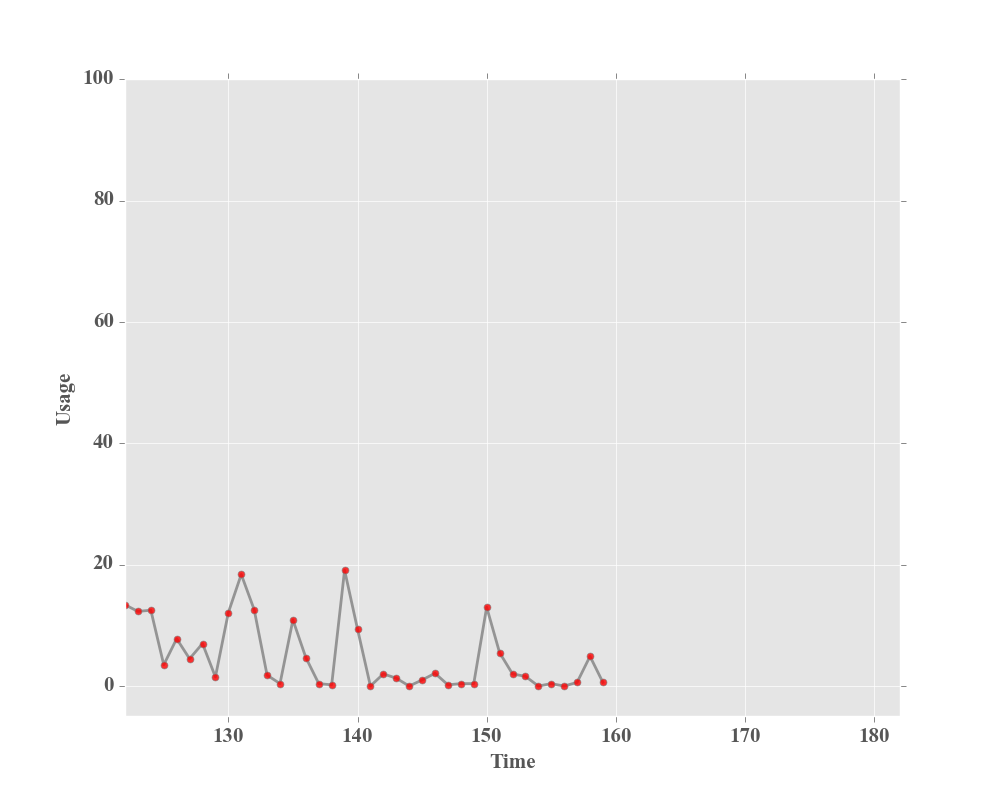
上面的代码在动画生成的过程中使用了发生器作为frames的生成方法,采样时间为100ms,那么每隔100ms则会从新绘制图像,由于此处是采用随机数绘制的,没有什么规律,因此下面调用Python的psutil模块实现CPU的检测。在psutil模块中使用cpu_percent函数获取CPU的使用率,并且可以在其中设置间隔时间,这里我设置的是1s,时间太短卡电脑,并且将frames的刷新步长也设置为1s,同步刷新一下,基本上可以实现CPU的监视功能:
|
1 2 3 4 5 6 7 8 9 10 11 12 13 14 15 16 17 18 19 20 21 22 23 24 25 26 27 28 29 30 31 32 33 34 35 36 37 38 39 40 41 42 43 44 45 46 47 48 49 50 51 52 53 54 55 56 57 58 59 60 61 62 63 64 65 66 67 68 |
# -*- coding: utf-8 -*- """ Created on Fri Nov 18 18:49:08 2016 @author: orycho """ import numpy as np from matplotlib.lines import Line2D import matplotlib.pyplot as plt import matplotlib.animation as animation import matplotlib import psutil matplotlib.style.use('ggplot') # Axis setting xRange = 60 ymin = -5 ymax = 100 class Scope(object): def __init__(self, ax, maxt=xRange): self.ax = ax self.maxt = maxt self.xdata = [0] self.ydata = [0] self.line = Line2D(self.xdata, self.ydata, ls='-',lw = 2, marker = '.', alpha=0.8, color='gray', mfc='red', ms = 10) self.ax.add_line(self.line) self.ax.set_ylim(ymin, ymax) self.ax.set_xlim(0, self.maxt) def update(self, y): # self.ax.set_xlim((max(self.xdata)-20) / 1.05, max(self.xdata) * 1.1) # self.ax.figure.canvas.draw() lastt = self.xdata[-1] if lastt > self.xdata[0] + self.maxt: self.xdata = [self.xdata[-1]] self.ydata = [self.ydata[-1]] self.ax.set_xlim(self.xdata[0], self.xdata[0] + self.maxt) self.ax.figure.canvas.draw() t = self.xdata[-1] + y[0] self.xdata.append(t) self.ydata.append(y[1]) self.line.set_data(self.xdata, self.ydata) return self.line def emitter(): while True: cpu = psutil.cpu_percent(interval=1) yield (1,cpu) fig, ax = plt.subplots(figsize=(10, 8), dpi=80, facecolor='w', edgecolor='k') plt.xlabel('Time',fontname="Times New Roman",fontsize = 15) plt.ylabel('Usage',fontname="Times New Roman",fontsize = 15) for tick in ax.get_xticklabels(): # 设置标签字体 tick.set_fontname("Times New Roman") tick.set_fontsize(15) for tick in ax.get_yticklabels(): tick.set_fontname("Times New Roman") tick.set_fontsize(15) scope = Scope(ax) # pass a generator in "emitter" to produce data for the update func ani = animation.FuncAnimation(fig, scope.update, frames = emitter, interval=1000, blit=False) plt.show() |
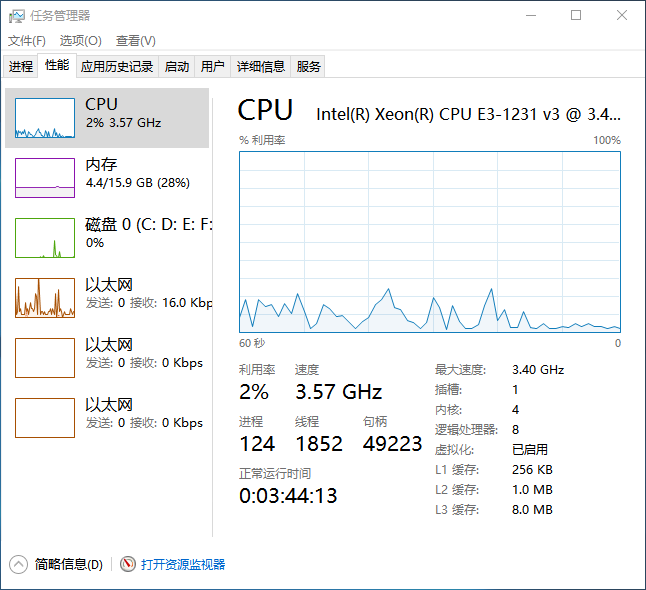
和任务管理器对比一下:

Matplotlib实现CPU监视

Matplotlib实现CPU监视
由于任务管理器采样好像只有0.5s,因此显示的效果要更加准确一点,如果需要缩短监视时间,只需要设置上面代码中的cpu_percent函数的时间间隔和frames的刷新间隔即可。
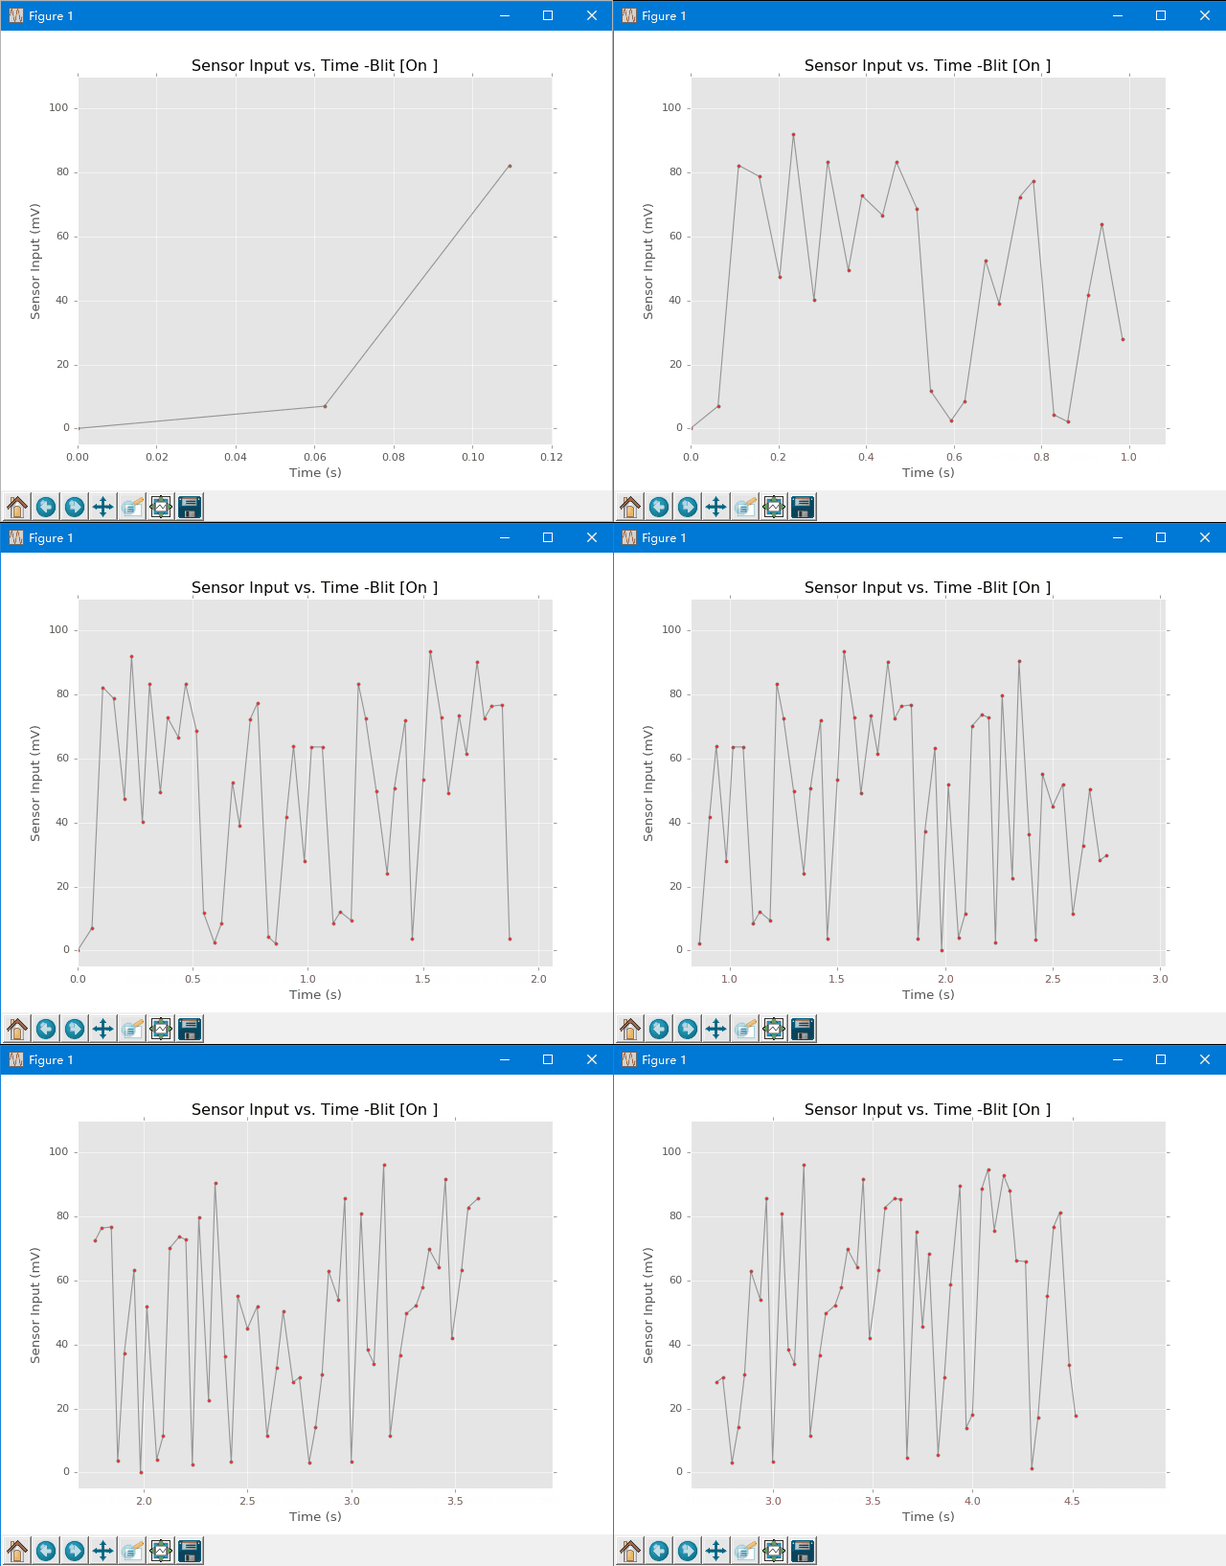
除了上面的方法可以使用Matplotlib的动画显示之外,还可以使用blit直接刷新图形,但是这样有一个缺点就是在动画显示的过程中不能点击图形,也就是刷新过程虽然会显示动画,但是很容易进程卡死,不过显示效果很不错,有兴趣的可以下载研究研究:

Matplotlib实现CPU监视
点击下载本文所有源代码:点击下载


